|
|
Case Study #1: Incorporating NASA MODIS Cloud Cover data into the Chesapeake Bay Programs Watershed Simulation Model The mission of the Chesapeake Bay Program (CBP) is to restore, enhance, and protect the living resources and their natural habitats, and protect human health within the Chesapeake Bay Watershed (CBW). The CBW covers over 64,000 square miles and counts its area in six states (New York, Pennsylvania, Delaware, Maryland, Virginia and West Virginia) as well as the District of Columbia (Figure 1). The watershed population is about 16 million and is expected to grow to 18 million by 2020. Of the 130 estuaries in United States, the Chesapeake Bay is the largest and most biologically diverse with more than 3,600 species of plants, fish and animals. It helps to support the region's economy as a major source of seafood and a major hub for shipping and commerce. In 1989, the value of the Bay was estimated at $678 billion (CB2K). The CBP is a partnership led by the Chesapeake Executive Council whose members include the governors of Maryland, Virginia and Pennsylvania; the mayor of the District of Columbia; the administrator of the U.S. Environmental Protection Agency and the chair of the Chesapeake Bay Commission. The Bay Program is representative of various regional organizations across the country that are charged with the stewardship of geographically complex and rapidly changing ecosystems whose health affects hundreds of thousands, if not millions, of persons on a regular basis. 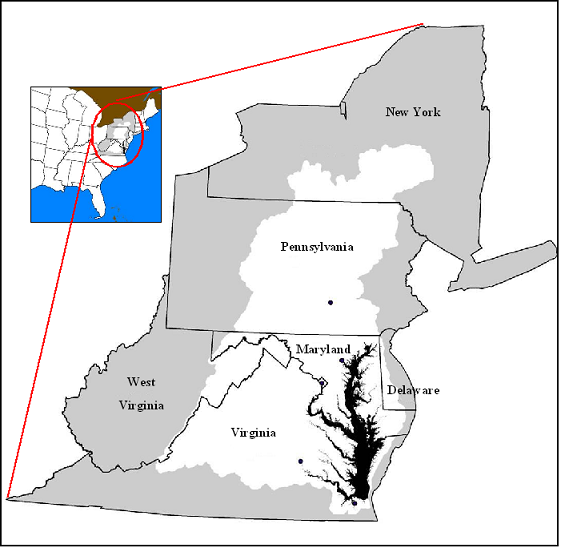
Figure 1: Location of the Chesapeake Bay Watershed In 1987, Maryland, Virginia, Pennsylvania and D.C, together with the Federal government, signed an agreement to reduce by 40% the amounts of nitrogen and phosphorus entering the Bay by the year 2000. Subsequent to this, the Chesapeake Bay 2000 agreement (CB2K) extended these commitments into the future and added the undertaking to correct, by 2010, the nutrient and sediment-related problems to a level which would remove the Bay, and the tidal portions of its tributaries, from the list of impaired waters under the Clean Water Act. Multi-billion dollar plans have been initiated to control runoff from urban areas, farmlands and pastures, to improve the treatment of sewage and to preserve forests and wetlands. Nutrient management plans have been implemented to control N and P from agriculture. In order to fulfill its mission, the CBP conducts daily to yearly assessments of various environmental parameters. Since 1985, it has developed and maintained an operational decision support system (DSS) to: (1) effectively simulate processes within the CBW, (2) estimate nutrient loads to the Bay, (3) evaluate the impacts of agricultural BMPs, and (4) provide management and policy recommendations to decision-makers (Donigan & Huber 1991, Linker et al. 1999, Linker et al. 2001, Wand et al. 1997). CBP has three interlinked models - Watershed, Airshed, and Estuary - which comprise programs DSS. In particular, the CBPs HSPF-based Watershed model is designed to simulate hydrologic, sediment and nutrient transport processes to the tidal regions of the Chesapeake Bay. The hydrologic submodel requires rainfall, evaporation and other meteorological data to calculate runoff and subsurface flow for all the basin land cover types including forest, agricultural and urban lands. The surface and subsurface flows ultimately drive the non-point source submodel, which simulates soil erosion and the pollutant loads from the land to the rivers. Through discussions with CBP, it was identified that the accuracy of the hydrological submodel is currently limited by the spatial qualities of the input data, particularly by the snow and cloud cover information which is used in modeling radiation, precipitation, and evapotranspiration. A determination of the cloud cover presence is essential to the CBP mission for two reasons. First, clouds play a critical role in the radiative balance of the Earth and must be accurately described in order to estimate solar radiation and potential evapotranspiration for the Chesapeake Bay Watershed Model (Wand et al. 1997). Second, clouds must be accurately assessed to understand and properly model atmospheric transport, mix, and deposition of pollutants by the Regional Acid Deposition Sub-Model of the Chesapeake Bay Airshed Model (Linker et al. 1999). Currently, the CBP relies on a limited number of ground-based observation stations to provide cloud cover input data for the DSS. Specifically, CBP obtains cloud cover data for the entire 64,000 square miles of the Chesapeake Bay Watershed from only seven meteo-stations and assigns the same cloud cover value to all model segments within the meteo-station vicinity. Therefore, CBP is greatly interested in replacing this data with remotely sensed cloud cover information which has a much finer spatial resolution and more adequately covers the watershed. Further, as meteo-station data becomes even sparser due to shrinking governmental budgets, the continued availability of cloud cover data, especially in much greater spatial and temporal detail than previously available, is paramount for the CBP DSS. After an investigation of NASA ESE satellite data, it was determined by the GDA team that the MODIS Cloud Mask Product may fit the job. MODIS is the key instrument aboard the Terra and Aqua satellites that is viewing the entire Earths surface every 1 to 2 days, acquiring data in 36 spectral bands between 0.405 and 14.385 µm, and at three spatial resolutions - 250m (Bands 1-2), 500m (Bands 3-7), and 1,000m (Bands 8-36). To date, the MODIS Science Team, NASA, has developed 44 products derived from the Level 0 and Level 1 MODIS data. Many of these have already been calibrated or validated by ground-truth data in various ecological systems. The Cloud Mask product is a mid-level MODIS product (Level 2 Swath) which is more difficult to work with than gridded Level 3 data. However, it does not require the extensive geolocation and ancillary data necessary for processing Level 0 / 1 data. The MODIS Cloud Mask product is generated at 1-km and 250-m (at nadir) spatial resolutions. There are two MODIS Cloud Mask data product files: MOD35_L2, containing data collected from the Terra platform and MYD35_L2, containing data collected from the Aqua platform. For any given non-polar region, there are 4 passes within a 24 hour period, one ascending and one descending for each platform. Since there are only two 250-m bands on the MODIS instruments, it is not possible to generate a quality cloud mask using only 250- m input data. To create the 250-m cloud mask, NASA combines collocated 1-km NIR and IR cloud test results with the 250-m input. While a result is reported for each 250-m pixel during daylight conditions, much of the input information is really at 1-km resolution. This can result in a "blocky"-looking 250-m cloud mask result relative to 250-m visible imagery. Regardless of this, the cloud mask products at both resolutions have been fairly well validated from a science perspective. There are a few known issues that are currently being addressed, including: (1) some false clouds indicated over coastlines, rivers, and inland lakes; false clouds indicated over some desert regions at night; and (3) aeorosol detection (smoke, fire, dust). The 1-km product, however, is more than sufficient for the current CBP DSS. The average size of a CBP land segment is 750 km2, with the smallest at 1.5 km2 and only 8 of the 308 under 10 km2. Since hourly data is required for the CBP meteorological parameters, CBP takes the current daily data from the 7 meteo-stations and extrapolates to hourly values. The MODIS Cloud Mask Product for the CBP region has anywhere from 4 to 8 distinct measurements per day thereby greatly increasing the current temporal resolution (Eight observations can be available for the overlap areas of MODIS scenes.) It was determined that data latency was currently not an issue with respect to cloud cover for the CBP DSS. Acceptable delivery times for new cloud cover data can be achieved by processing cloud data from the NASA Data Gateway FTP. However, when CBP brings its DSS up to near-real time in the future, GDA will acquire the Cloud Mask Product from one of the Direct Broadcast sites or implement a procedure to derive the product from DB imagery directly. Once it was verified that the MODIS Cloud Mask Product specifications met, or in this case exceeded, CBP requirements, GDA proceeded to acquire an adequate sample of MODIS data for validation purposes. GDA and CBP identified the validation period when available MOD35 cloud cover information and CBP in-situ observations overlap. (The Aqua MODIS data stream did not start until July 2002 and therefore MYD35 data was not included in the validation at this time). The identified time period covers February 24 - January 31, 2000. For this 10 month time period, GDA obtained approximately 1,100 granules of MOD35, version 5 data from ftp://g0dps01u.ecs.nasa.gov/MODIS_Terra_Atmosphere/MOD35_L2.005/. To process collected data, GDA developed a set of C++ and Python scripts which allow to automatically
format, project, and subset MODIS data and to generate required outputs. For validation, and eventual
delivery, purposes, the image products were converted to GeoTIFF format, re-projected to UTM, Zone 18N,
and subsetted to the area of CBW. Next, the CBP model segmentation file was rasterized to match the
resolution, projection, and geolocation of the input MODIS data. This file, along with the reformatted
MODIS cloud mask products, was then used to compute cloud cover percentages per model segment. Output
was automatically produced in two formats: (1) 370 ASCII-formatted text files (one per segment), with
columns corresponding to MODIS acquisition year, month, day, and calculated per segment percent cloud
cover and (2) a vector ESRI shapefile in UTM-18n showing per segment percent cloud cover for a given
MODIS observation (see Figure 2 for overview).
Next, the output files were used to validate that the MODIS data is an appropriate replacement for CBPs existing cloud datasets. Two procedures were utilized for the validation. First, GDA independently compared in-situ meteo-station daily data on cloud cover provided by the CBP with percent cloud cover scores derived from the MOD35 product. Currently, cloud information used by the CBP is obtained from the following meteo-stations: 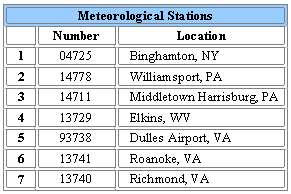
Table 1. Current Sources of Cloud Data for the Chesapeake Bay Watershed In order to compare CBP and MOD35 datasets, a decision had to be made on how to correspond meteo-station cloud observations with a ground observers field-of-view (FOV). Discussions with CBP, as well as varying kernel-size tests, suggested that the collection of MOD35 data for an area within a half degree radius from the location of the meteo-station would provide a good representation of the ground observers FOV. As a result, each MOD35 dataset was subsetted to the area within a ½ degree radius of each station and percent cloud cover for each area was calculated for the cases when MOD35 data covered between 50% and 100% of the area. MOD35 data for a given station was excluded from the analysis if less than 50% of the area was covered. Next, all measurements for a given station, given day were averaged to acquire a daily percent cloud cover value. Finally, MOD35-based daily cloud cover scores were compared to corresponding ground observations. This provided direct validation data to ensure that the processed MOD35 data agrees with the existing cloud information. A rather significant - 50 to 70 percent - correlation between cloud station and MOD35 values was identified (Figure 3). The results suggest that MODIS is a good (and more spatially coherent) substitute to the meteo-station cloud observations. Also, it can be expected that with the future introduction of MYD35 cloud data from Aqua for 2002+ time period (in addition to the MOD35 data stream from Terra), the increase in the number of daily observations will further increase the quality of cloud cover assessments. 
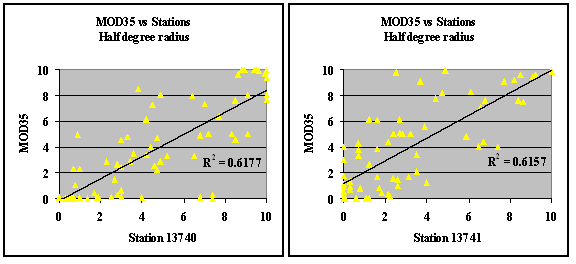
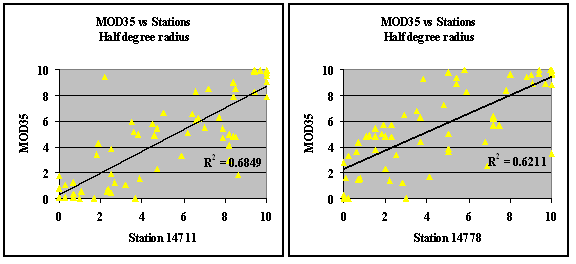

Figure 3: Correlation between MOD35 data and ground cloud observations Second, CBP independently ran the watershed model with and without the MODIS cloud cover data and generated model output simulations, or average-adjusted flow loads. These loads were then compared with observed loads at 260 stations throughout the watershed at which data on stream flow from the USGS and water quality from individual state DEPs are collected. Cumulative distributions (e.g., flow duration curves) were developed, and the data was then optimized for overall goodness-of-fit, as judged by the model efficiency. The Nash-Sutcliffe (NS) model efficiency statistic, which has been recommended by the ASCE (1993) for hydrological studies, can be mathematically defined as:  where: NS values equal to 1 indicate a perfect fit between observed and predicted data, while NS values equal to 0 indicate that the model is predicting no better than using the average of the observed data. The results of introducing the MODIS cloud data into the CBP are summarized below in Table 1. The MODIS data improved the model for 64% of the stations (166 stations out of 260). For 35% of the stations, the meteo-station data performed better. In 1% of the cases, there was no difference in performance. CBP notes that while they are unsure as to why there were cases in which the fixed station data performed better, the differences were very minor.
Table 2. Overall Improvement in Model Efficiency Figure 4 illustrates the overall improvement in model efficiency during the iterative calibration process. At each iteration, average model efficiency was higher with MOD35 data. Overall, CBP is pleased with the introduction of MODIS cloud cover and is anxious for other inputs, such as precipitation. For CBP's current Phase 4.3 WSM, cloud cover data is used for the 1/1/1984 through 12/31/2000 time period. As CBP is currently transitioning to the use of the new Phase 5 model, which will extend the model simulations out to 2004, they plan on using MODIS cloud cover data delivered by GDA for all input data from 2001 to 2004. 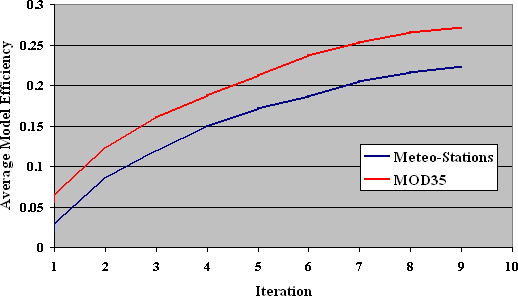
Figure 4: Average Model Efficiency - Fixed Meteo-Station Data versus MODIS Data Currently, NASA is producing the next generation of MODIS data products, called Collection 005. Collection 005 MODIS data will be earmarked by significant improvements in almost every key data product (SDS parameter), including the 35_L2 Cloud Mask product. The production started in February 2005 with the reprocessing of the Terra (AM overpass) MODIS data beginning at the start of the Terra MODIS data stream (February 2000) moving forward. In April 2005, the Collection 005 reprocessing effort will be doubled when Aqua (PM overpass) MODIS data is reprocessed beginning at the start of the Aqua MODIS data stream (July 2002) moving forward. All reprocessing to Collection 005 is scheduled to be completed by July 2005. GDA continues to work with CBP to deliver a complete cloud cover dataset for input to their DSS. Other input datasets are to follow. Should future NASA RS inputs prove to be useful to the CBP DSS, it is conceivable that with enough RS inputs, the models will be able to be run in near-real time, in which case, CBP will require weekly updates to the cloud cover, and other, RS datasets. Acknowledgements: GDA Corp. would like to thank Dr. Gary Shenk and Mr. Peter Claggett of the Chesapeake Bay Program (Annapolis, MD) for their help in preparing this case study. References: ASCE Task Committee on Definition of Criteria for Evaluation of Watershed Models, Watershed Management Committee, Irrigation and Drainage Division (ASCE). 1993. Criteria for evaluation of watershed models. J. of Irrigation and Drainage Engineering, 199(3): 429-442. CB2K: Chesapeake Bay 2000 Agreement. http://www.chesapeakebay.net/agreement.htm. Donigan, A.S. and W.C. Huber. 1991. Modeling of non-point source water quality in urban and non-urban areas. EPA/600/3-91/039, U.S. EPA, Environmental Research Lab., Athens, GA. Linker, L.C., G.W. Shenk, R.L. Dennis, and J.S. Sweeney. 1999. Cross-Media models of the Chesapeake Bay Watershed and Airshed. Annapolis, MD. (http://www.chesapeakebay.net/pubs/948.pdf). Linker, L.C., G.W. Shenk, P. Wang, K.J. Hopkins, and S. Pokharel. 2001. A short history of the Chesapeake Bay Program modeling and the next generation of watershed and estuarine models. US EPA Chesapeake Bay Program. Annapolis, MD. 15 pp. (http://www.chesapeakebay.net/pubs/). Wand, P., L.C. Linker, and J. Storrick. 1997. Chesapeake Bay Watershed Model application and Calculation of Nutrient and Sediment Loadings. Appendix D: Phase IV Chesapeake Bay Watershed Model Precipitation and Meteorological Data Development and Atmospheric Nutrient Deposition. A report of the Chesapeake Bay Program Modeling Subcommittee. Annapolis, MD. (http://www.chesapeakebay.net/pubs/112.pdf).
|
|||||||||||||||||||
